Executive Summary: Why Leading Manufacturers Choose RTO Technology
Regenerative Thermal Oxidizers (RTOs) represent the gold standard in industrial VOC treatment, combining exceptional destruction efficiency (typically 99%+) with unprecedented energy recovery capability (95%+). For plant managers, environmental engineers, and sustainability officers seeking compliant, cost-effective emission control, this comprehensive guide provides actionable insights on RTO selection, operation, and optimization.
Part 1: The Engineering Breakthrough Behind RTO Efficiency
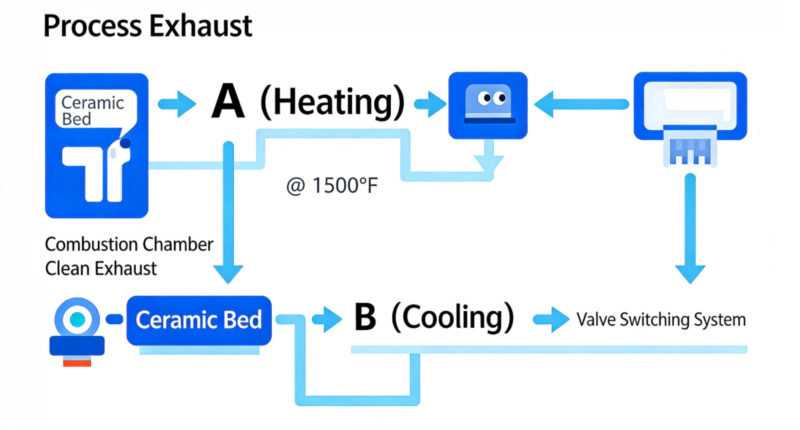
How RTO Technology Works: The Thermal Cycling Principle
Unlike traditional thermal oxidizers that waste heat, RTO systems use ceramic heat exchange media in multiple chambers to create a continuous heat recovery cycle:该循环过程可在 VOC 浓度低至 1.5-2.0 g/m³ 的情况下实现自热运行,与传统系统相比,可节省高达 90% 的补充燃料成本。
Key Performance Indicators for Industrial Applications
| Parameter | Standard RTO | High-Efficiency RTO | Industry Average |
|---|---|---|---|
| VOC Destruction Rate | 98-99% | 99.0-99.5% | 95-97% |
| Heat Recovery Efficiency | 93-95% | 95-97% | 85-90% |
| Pressure Drop | 3.0-4.0″ w.g. | 2.0-2.5″ w.g. | 4.0-6.0″ w.g. |
| Self-Sustaining Concentration | 1.8-2.2 g/m³ | 1.5-1.8 g/m³ | 2.5-3.5 g/m³ |
Part 2: Industry-Specific RTO Applications and Case Studies
Chemical Processing: Treating Complex VOC Streams
Challenge: Pharmaceutical manufacturing with chlorinated solvents and variable loading
Solution: 3-chamber RTO with pre-scrubber and DRE monitoring
Results: 99.2% DRE maintained despite 4:1 turndown ratios, achieving 11-month ROI
Printing & Coating: High Volume, Low Concentration
Challenge: Web offset printing with toluene/MEK emissions at 0.8-1.2 g/m³
Solution: Rotary concentrator + RTO hybrid system
Results: 96% overall energy reduction, LEED certification points earned
Food & Beverage: Managing Odor and Ethanol Emissions
Challenge: Ethanol emissions from fermentation at 1.5-3.0 g/m³ with odor concerns
Solution: 2-bed RTO with integrated thermal recuperator
Results: 99.5% odor removal, natural gas consumption reduced by 82%
Part 3: 7-Step RTO Selection Framework
Step 1: Comprehensive Stream Characterization
- Gas Chromatography analysis for speciated VOC profile
- Continuous monitoring of concentration variability
- Particulate loading assessment (critical for media selection)
Step 2: Technology Configuration Analysis
Decision Tree: 1. VOC Concentration < 1.5 g/m³ → Consider concentrator + RTO 2. Concentration 1.5-4.0 g/m³ → Standard 2- or 3-bed RTO optimal 3. Concentration > 4.0 g/m³ → Evaluate supplemental heat recovery 4. High halogen content → Require specialized materials of construction
Step 3: Total Cost of Ownership Modeling
5-Year TCO Comparison for 30,000 SCFM System:
| Cost Component | Traditional RTO | High-Efficiency RTO | Savings |
|---|---|---|---|
| Capital Investment | $850,000 | $1,050,000 | -$200,000 |
| Annual Fuel Cost | $185,000 | $42,000 | +$143,000/yr |
| Annual Maintenance | $35,000 | $28,000 | +$7,000/yr |
| 5-Year Total | $2,050,000 | $1,436,000 | +$614,000 |
Steps 4-7: Installation, Commissioning & Optimization
Detailed protocols for ductwork design, safety systems, startup procedures, and predictive maintenance scheduling.
Part 4: Advanced RTO Optimization Strategies
Digital Twin Implementation
Real-time simulation models that predict system response to process changes, enabling:
- Predictive valve maintenance scheduling
- Optimal temperature setpoint adjustment for varying conditions
- Energy consumption forecasting with 94% accuracy
Emissions Monitoring & Reporting Automation
Modern RTOs integrate with continuous emissions monitoring systems (CEMS) to:
- 生成自动合规报告(第五章,NESHAP)
- 向企业ESG平台提供实时数据
- 启用远程监管机构访问
Part 5: Common Implementation Challenges & Solutions
Challenge 1: Particulate Fouling in Ceramic Media
Solution: Implement multi-stage filtration with differential pressure monitoring and automated pulse-jet cleaning cycles.
Challenge 2: Variable Process Conditions
Solution: Advanced control algorithms using machine learning to adapt to changing VOC loads while maintaining destruction efficiency.
Challenge 3: High-Temperature Material Degradation
Solution: Use 310S stainless or Inconel for critical components in halogenated service with continuous corrosion monitoring.
Part 6: Regulatory Compliance & Sustainability Benefits
Meeting Global Standards
- USA: NESHAP, MACT, Title V compliance
- EU: BAT compliance under IED
- Asia: China’s Blue Sky Initiative requirements
Carbon Reduction & ESG Impact
A properly optimized RTO system can:
- Reduce Scope 1 emissions by 90-99%
- Lower operational carbon footprint by 1,000-5,000 MT CO₂e annually
- Contribute to LEED, BREEAM, or Green Factory certifications
- Generate carbon credits in regulated markets
Part 7: Future Trends & Technology Roadmap
Next-Generation RTO Developments
- Phase-Change Materials replacing ceramic media for 40% higher energy density
- Additive-manufactured heat exchangers with optimized fluid dynamics
- Autonomous control systems using AI for real-time optimization
- Modular, skid-mounted designs reducing installation time by 60%
Professional Guidance: When to Engage RTO Specialists
Red Flags in Vendor Proposals
- Lack of site-specific performance guarantees
- No pilot testing offered for unique streams
- Insufficient reference plants in your industry
- Vague warranty and service terms
The Due Diligence Checklist
- Request CFD modeling of proposed design
- Verify third-party performance testing on similar applications
- Review preventive maintenance requirements
- Confirm remote monitoring capabilities
- Evaluate spare parts availability and lead times
Conclusion: RTO as Strategic Investment
Modern Regenerative Thermal Oxidizers have evolved from pollution control devices to strategic assets that deliver regulatory compliance, energy recovery, sustainability leadership, and operational resilience throughout their 20+ year service life.
Ready to Evaluate RTO for Your Facility?
Contact our engineering team for:
- Site-specific feasibility assessment
- Pilot testing program design
- Total cost of ownership analysis
- Regulatory compliance review
Data-driven decisions start with comprehensive analysis.


